When you look at those magazine covers with super-fit models on it, doesn’t it tickle your curiosity as to what do they do to get in such good shape? Yes, we all feel the same! This desire for getting in good shape and bidding goodbye to the unappealing flab is something that could help you in getting on a weight loss regime.
The idea behind shedding those extra pounds is to attain the “ideal” weight. Now how do you get to know this ideal weight?
Several factors play a role in determining the ideal weight of a person, these include age, gender, muscle-fat ratio, height, body fat distribution, and body shape.
I understand, you came here seeking a number or range for your ideal weight and all this might seem confusing to you. Don’t worry, I will try my level best to give you all the required information that would help you identify your ideal weight, keeping all these factors into consideration. Just read on 🙂
Ways to Calculate your Ideal Weight
#1 Height and Weight chart based on BMI
Body Mass Index or BMI as it is commonly called, is the most popular ratio to know your ideal body weight and many healthcare experts use it on a regular basis.
BMI is calculated based on two factors: height and weight.
Mathematically, BMI = weight (in kilograms) / [height (in metres)] 2
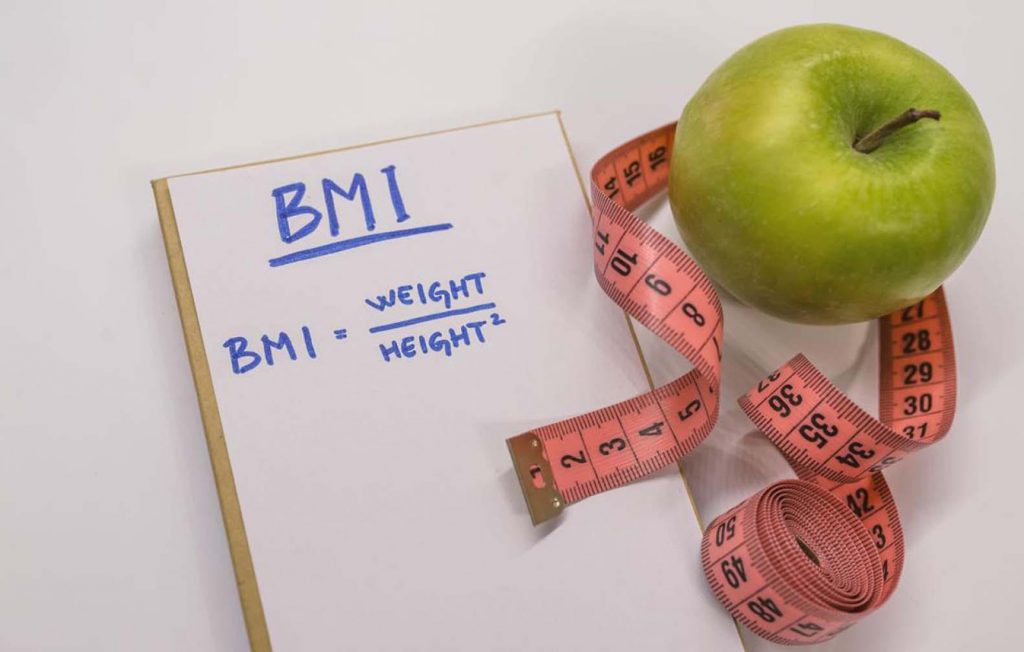
Or simply, you can use a BMI calculator to know your Body mass index based on your height and weight.
Calculate your BMI
According to the National Institutes of Health (NIH), the following BMI ranges determine if a person is underweight or obese:
- Underweight: BMI of less than 18.5
- Ideal: BMI between 18.5 and 24.9
- Overweight: BMI between 25 and 29.9
- Obese: BMI over 30
Now, let us identify what should be your weight according to height based on the BMI. The height and weight charts are gender-specific due to the anatomical and other differences between males and females.
Height and Weight Chart for Men
The ideal weight for men can be obtained from the ranges mentioned in the following height and weight chart:
| Height | Weight | ||
| Inches | Centimeters | Kilograms | Pounds |
| 4’6” | 137 | 28.5 – 34.9 | 63- 77 |
| 4’7” | 140 | 30.8 – 38.1 | 68- 84 |
| 4’8” | 142 | 33.5 – 40.8 | 74- 90 |
| 4’9” | 145 | 35.8 – 43.9 | 79- 97 |
| 4’10” | 147 | 38.5 – 46.7 | 85- 103 |
| 4’11” | 150 | 40.8 – 49.9 | 90- 110 |
| 5’0” | 152 | 43.1 – 53 | 95- 117 |
| 5’1” | 155 | 45.8 – 55.8 | 101- 123 |
| 5’2” | 157 | 48.1 – 58.9 | 106- 130 |
| 5’3” | 160 | 50.8 – 61.6 | 112- 136 |
| 5’4” | 163 | 53 – 64.8 | 117- 143 |
| 5’5” | 165 | 55.3 – 68 | 122- 150 |
| 5’6” | 168 | 58 – 70.7 | 128- 156 |
| 5’7” | 170 | 60.3 – 73.9 | 133- 163 |
| 5’8” | 173 | 63 – 70.6 | 139- 169 |
| 5’9” | 175 | 65.3 – 79.8 | 144- 176 |
| 5’10” | 178 | 67.6 – 83 | 149- 183 |
| 5’11” | 180 | 70.3 – 85.7 | 155- 189 |
| 6’0” | 183 | 72.6 – 88.9 | 160- 196 |
| 6′ 1″ | 185 | 75.3- 91.6 | 166- 202 |
| 6′ 3″ | 188 | 77.5- 94.8 | 171- 209 |
| 6′ 4″ | 191 | 79.8 – 98 | 176- 216 |
| 6′ 4″ | 193 | 82.5- 100.6 | 182- 222 |
Height and Weight Chart for Women
The ideal weight for women can be obtained from the ranges mentioned in the following height and weight chart:
| Height | Weight | ||
| Inches | Centimeters | Kilograms | Pounds |
| 4’6” | 137 | 28.5 – 34.9 | 63 – 77 |
| 4’7” | 140 | 30.8 – 37.6 | 68 – 83 |
| 4’8” | 142 | 32.6 – 39.9 | 72 – 88 |
| 4’9” | 145 | 34.9 – 42.6 | 77 – 94 |
| 4’10” | 147 | 36.4 – 44.9 | 81 – 99 |
| 4’11” | 150 | 39 – 47.6 | 86 – 105 |
| 5’0” | 152 | 40.8 – 49.9 | 90 – 110 |
| 5’1” | 155 | 43.1 – 52.6 | 95 – 116 |
| 5’2” | 157 | 44.9 – 54.9 | 99 – 121 |
| 5’3” | 160 | 47.2 – 57.6 | 104 – 127 |
| 5’4” | 163 | 49 – 59.9 | 108 – 132 |
| 5’5” | 165 | 51.2 – 62.6 | 113 – 138 |
| 5’6” | 168 | 53 – 64.8 | 117 – 143 |
| 5’7” | 170 | 55.3 – 67.6 | 122 – 149 |
| 5’8” | 173 | 57.1 – 69.8 | 126 – 154 |
| 5’9” | 175 | 59.4 – 72.6 | 131 – 160 |
| 5’10” | 178 | 61.2 – 74.8 | 135 – 165 |
| 5’11” | 180 | 63.5 – 77.5 | 140 – 171 |
| 6’0” | 183 | 65.3 – 79.8 | 144 – 176 |
| 6′ 1″ | 185 | 67.6- 82.5 | 149 – 182 |
| 6′ 2″ | 188 | 69.4- 84.8 | 153 – 187 |
| 6′ 3″ | 191 | 71.6- 87.5 | 158 – 193 |
| 6′ 4″ | 193 | 73.5- 89.8 | 162 – 198 |
These values are calculated based on BMI. While BMI is often used as a screening tool to determine if your weight could be putting you at risk of health problems like high blood pressure, cholesterol, heart problems, diabetes, etc, it is not foolproof and cannot be considered as the only way to gauge the ideal weight.
If your weight is more than the ideal for your height mentioned in the chart shown above, isn’t it tempting to think that it is because maybe you have more muscles and your muscle mass is higher? This may be true in some cases, like athletes. Their BMI values and weight as per height would be much more than that mentioned in the chart. This doesn’t mean they are overweight instead, it is because they have more muscle mass and less fat.
However, most people usually weigh more because they have more body fat. Let’s explore the other more accurate ways of calculating your ideal weight.
#2 Waist-to-Hip-Ratio (WHR)

Ideally, your waist should have a smaller circumference compared to your hips. To calculate your waist-to-hip ratio:
- Measure your waist around the narrowest part, above the belly button.
- Divide this value by the measurement around your hips at the widest part.
Say, your waist measures 30 inches and hips, 38 inches, divide 30 by 38, to get your WHR of 0.78.
According to WHO, people with a waist-to-hip ratio of more than 0.90 in men and 0.85 in women suffer from abdominal obesity.
| Health risk | Women | Men |
| Low | 0.80 or lower | 0.95 or lower |
| Moderate | 0.81–0.85 | 0.96–1.0 |
| High | 0.86 or higher | 1.0 or higher |
People who store more body fat around their midsection have an increased risk of health problems compared to people who store body fat around their hips.
Does this get you worried? Don’t be as there are various easy ways to help get rid of that extra fat layer around your waist. To know more, read 9 Most Effective Ways to Reduce Belly Fat (Backed by Science).
#3 Waist-to-Height-Ratio (WtHR)
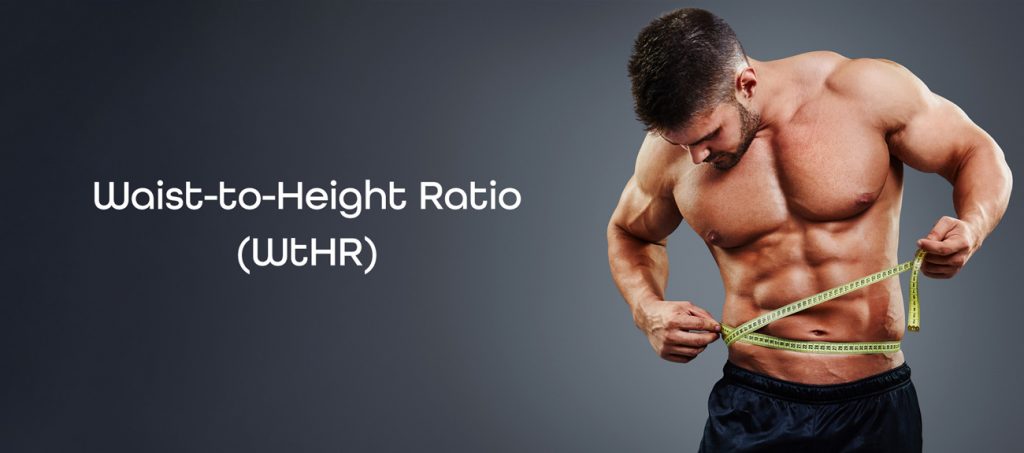
The waist-to-height ratio is another way to calculate the ideal weight for men and women. To calculate the WtHR, divide your waist size by height. If the answer is less than 0.49, you have a healthy weight.
Let’s take an example here if your waist size is 32 inches (81cm) and height is 5 feet and 5 inches(168 cm), your waist to height ratio would be 81/168 i.e. 0.48, which is in the healthy weight range.
#4 Body Fat Percentage
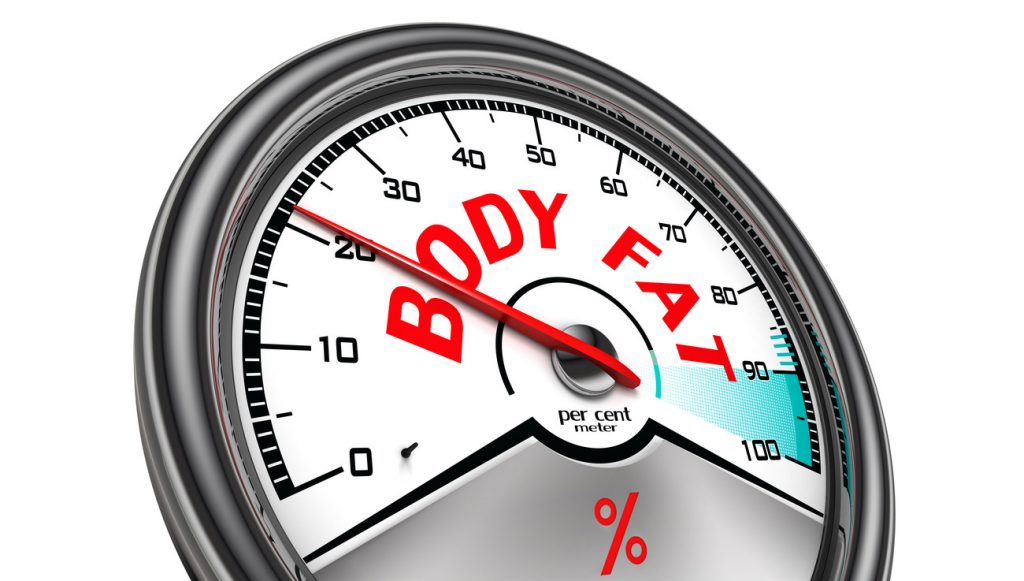
As the name suggests, the body fat percentage is the percentage of fat that your body contains. Say, you weigh 140 pounds (63.5 kgs) and your body fat percentage is 10%, it means that your body consists of 14 pounds (6.35 kgs) of fat and 126 pounds (57.15 kgs) of lean body mass (comprising of bones, muscles, organ tissues, blood, and everything else).
A healthy body has more lean muscle mass and less fat. There might be a possibility that your weight falls in the “ideal” range as per BMI but you have a high body fat percentage, which indicates having fewer muscles. Since, muscles play a vital role in maintaining overall health and wellness, going short on them and high on fat would take a toll on your fitness.
Calculate your body fat percentage:
To see if your body fat percentage lies in the healthy range, refer to the below chart:
Body Fat Percentage Chart for Women
| Age | Underfat | Healthy Range | Overweight | Obese |
| 20-40 yrs | Under 21% | 21 – 33% | 33 – 39% | Over 39% |
| 41-60 yrs | Under 23% | 23 – 35% | 35 – 40% | Over 40% |
| 61-79 yrs | Under 24% | 24 – 36% | 36 – 42% | Over 42% |
Body Fat Percentage Chart for Men
| Age | Underfat | Healthy Range | Overweight | Obese |
| 20-40 yrs | Under 8% | 8 – 19% | 19 – 25% | Over 25% |
| 41-60 yrs | Under 11% | 11 – 22% | 22 – 27% | Over 27% |
| 61-79 yrs | Under 13% | 13 – 25% | 25 – 30% | Over 30% |
So, now since you have familiarised yourself with the 4 ways of assessing the ideal healthy weight, combining them may be the best way to get an accurate idea of whether you should consider taking an action or not.
Summary
The ideal weight for men and women can be gauged by 4 ways: Height and weight chart based on BMI, Waist-to-hip-ratio, Waist to height ratio, and the Body fat percentage. None of these ways are flawless as there might be various factors influencing your ideal weight like age, gender, body shape, etc.
Just remember, don’t let perfect be the enemy of the good! it may not be realistic for you to get down to the idealistic weight range, but you can still do a lot for your health! It is more important to adhere to a healthy lifestyle and make smart choices than achieving a mere number. Stay healthy, stay happy 🙂


